
Anomaly Detection for Autonomous Medical-Delivery Drones
Last Edited on July 05, 2026
My engagement with Zipline ran through Machine Learning at Berkeley (ML@B), the student association that pairs Berkeley students with paid client consulting work. We took on Zipline near the start of its evolution into what is now a national-scale drone delivery network for lifesaving medical supplies. The team visited Zipline's operations directly at their Monterey ranch, and later presented our results at Zipline Demo Day II.
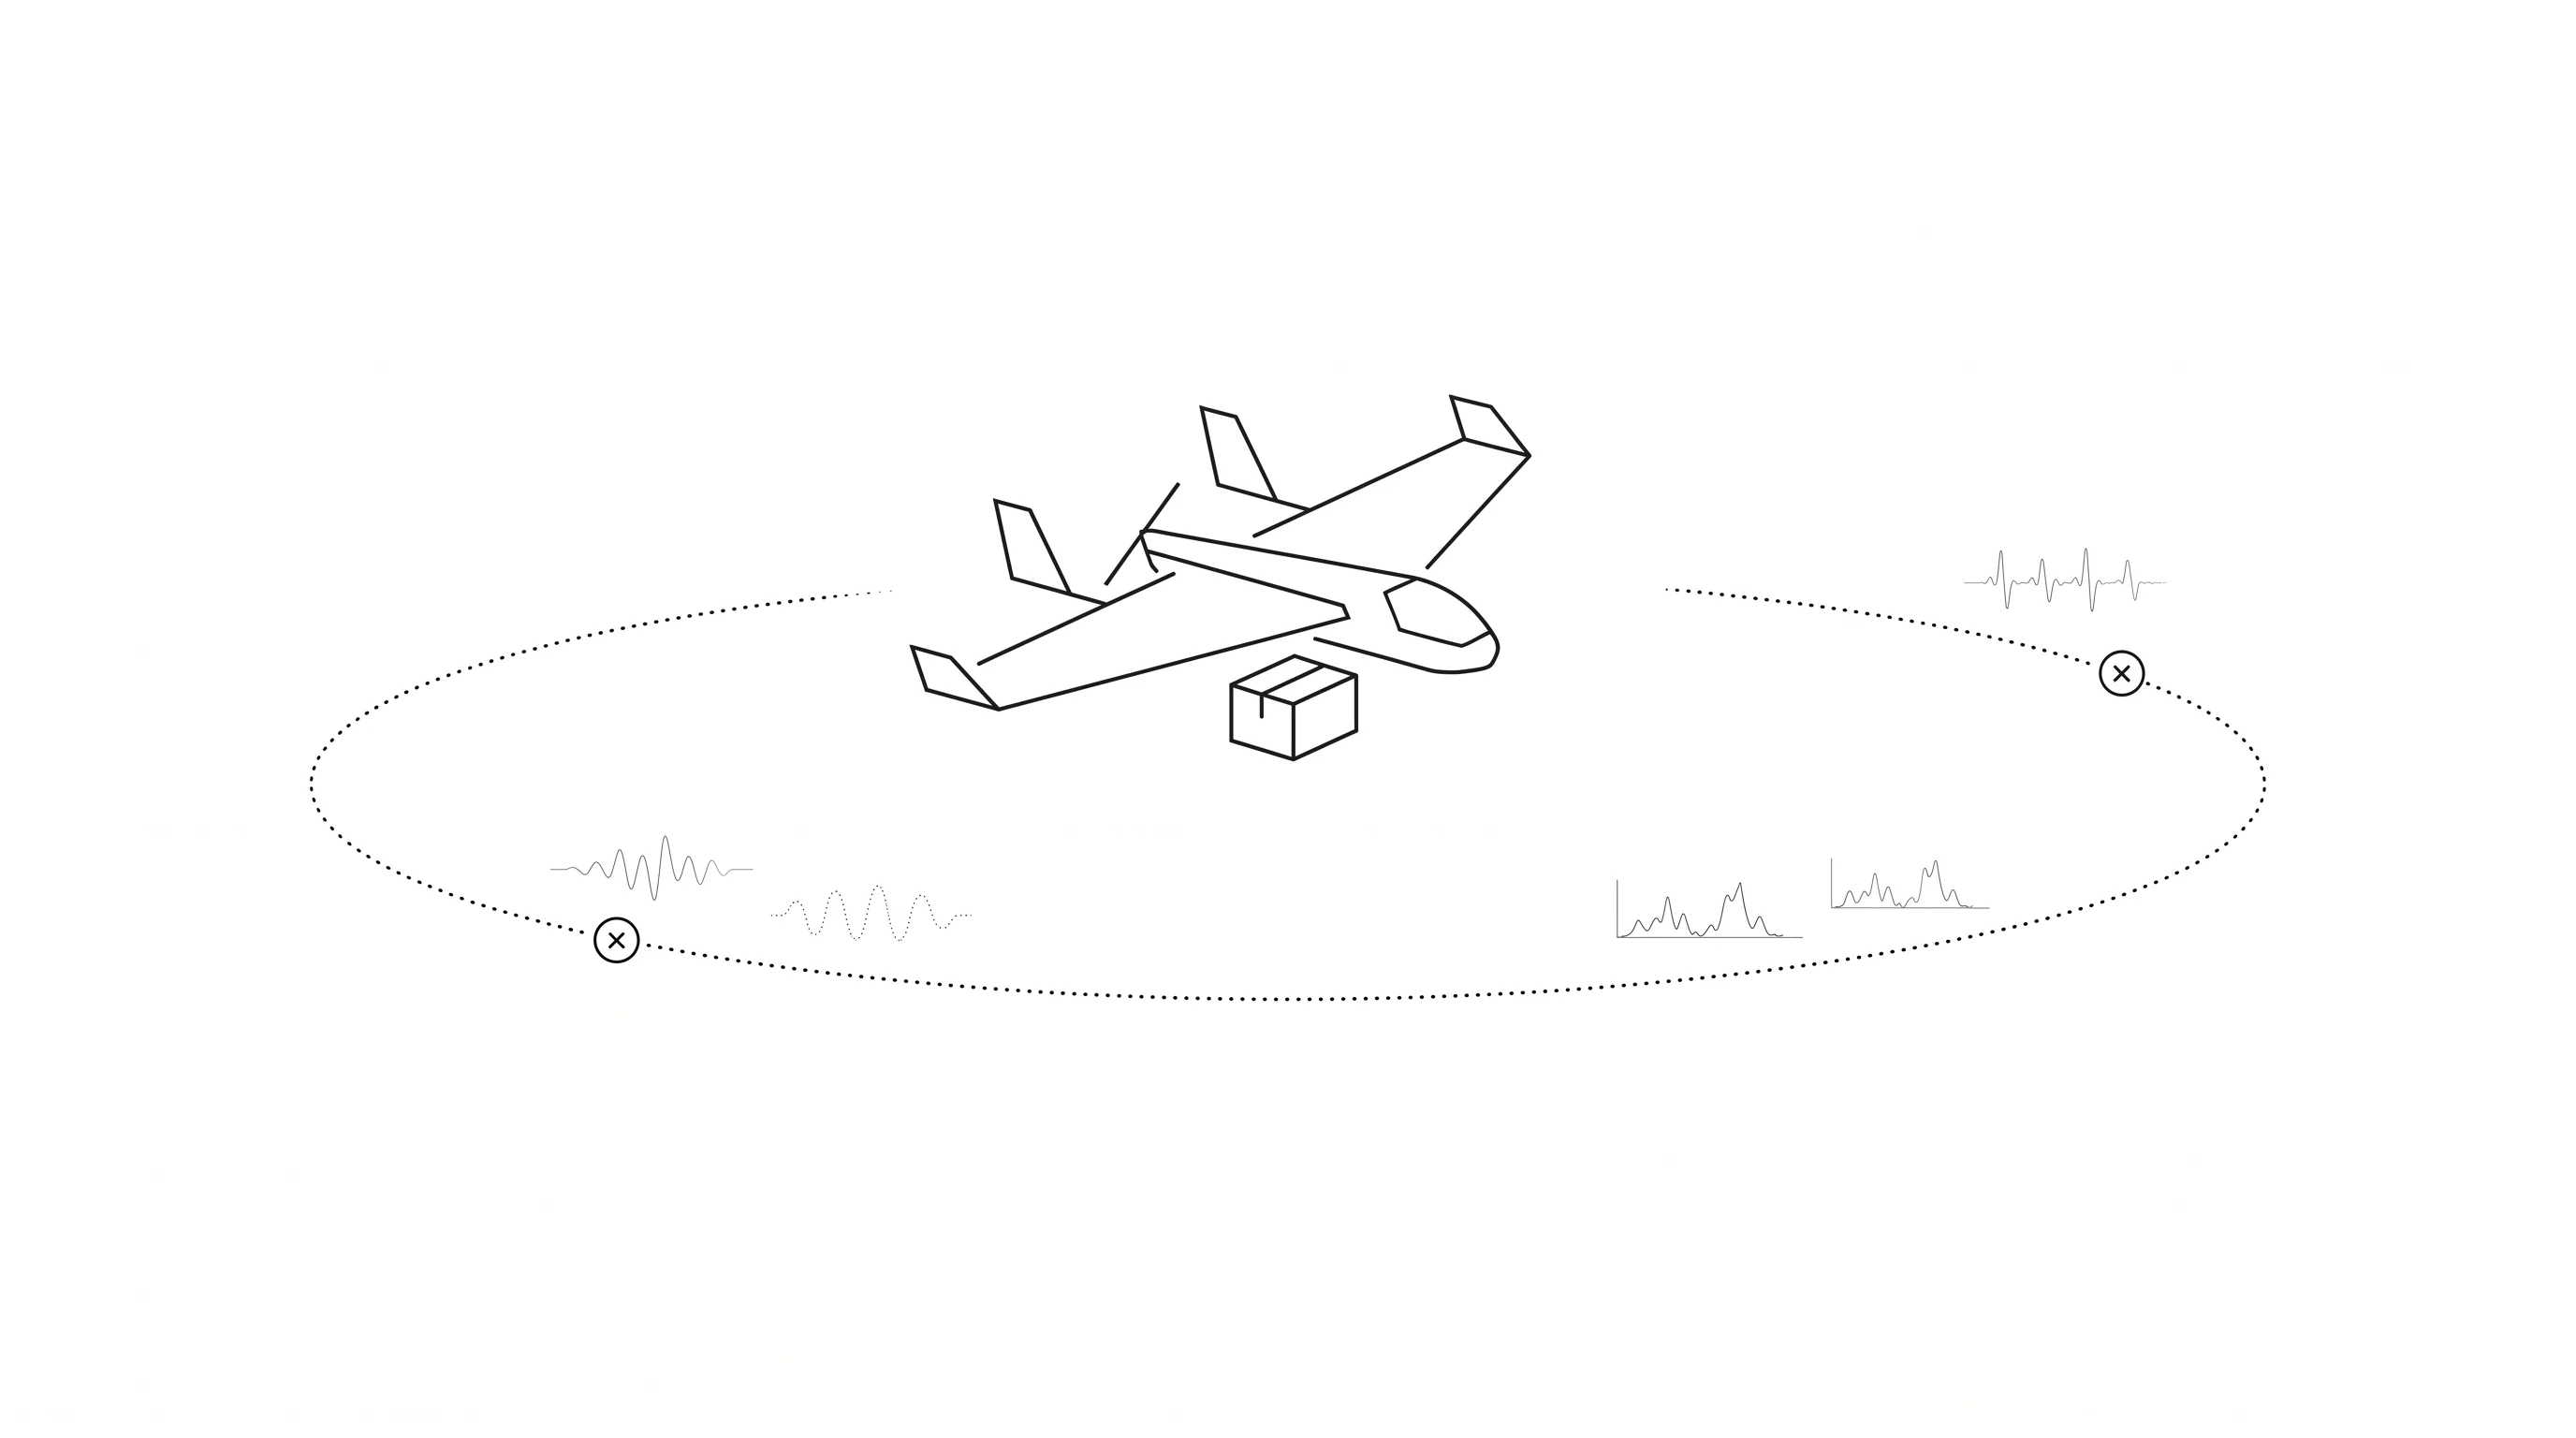
Zipline's mission was straightforward to state and hard to execute: fly blood units and other medical supplies to clinics that ground vehicles cannot reach in time. In Rwanda, that meant thousands of blood units delivered across thousands of flights. Every flight logged roughly 200 MB of telemetry, hundreds of time series alongside flight metadata, and none of it was labeled. There was no field marking a flight as normal or a component as failing, so anything we built had to work without ground truth.
Our brief was to extract insights from that telemetry and flag malfunctioning components before they became failures. We pulled the flight logs directly from Zipline's S3 buckets. The channels spanned airdata, inertial measurement unit (IMU) readings, NovAtel GPS, guidance commands, payload-release events, Robin battery-management-system status and power telemetry, Volz servo status, and ZIPNAV navigation output, each sampled at its own rate and format. Making those heterogeneous channels comparable across flights was as much of the problem as the modeling itself.
I led the machine learning side of the project. We deserialized the raw logs, separated flights by destination health center, extracted the most salient features from each series, and aligned everything in time and frequency so that flights and components could be compared on equal footing. From there we ran two independent unsupervised pipelines, each feeding into a shared component-wise analysis.
The first pipeline used Dynamic Time Warping (DTW) to compare flights signal by signal. DTW aligns time series that are variable in length or shifted in time, and we used the area under its warping-path curve as a similarity metric between any two flights. Computing that pairwise distance for every flight produced a DTW-distance matrix, which we fed into hierarchical clustering to surface outlier flights. Summing each signal's DTW distance to every other signal gave us an anomaly matrix across the full set of telemetry channels, computed separately for each aircraft component: BatteryA, FlightPrimary, Mission, TailInboard, TailOutboard, WingLeft, WingRight, and others. A component traceback then mapped a flagged anomaly back to the specific hardware serial number that flew that mission, which is what made the output actionable for a maintenance team rather than just a statistic.
The second pipeline trained a sequence-to-sequence LSTM autoencoder to reconstruct short chunks of flight telemetry, about four seconds at a time, compressing each chunk into a low-dimensional latent representation of flight dynamics. Anomalies could then be read off two ways: from flights whose reconstruction error spiked, or from outliers in the latent space itself, which we separated with clustering and a one-class SVM. Visualizing that latent space with PCA and t-SNE showed clear per-flight cluster structure, which gave us some confidence the autoencoder was learning flight dynamics rather than noise. We were also prototyping a third, ARIMA-based metric that forecast each signal forward and scored anomalies as the distance between the forecast and the observed value, though that work was still in progress when the engagement ended.
Alongside the anomaly detection itself, we built exploratory tools to make the telemetry legible: 3D plots of flight trajectories, and a network graph of hardware interactions colored by failure rate. Those visualizations mattered as much as the models. They gave a way to see where anomalies clustered before deciding what to trust.

The project was a team effort with Phillip Kravtsov, Samyak Parajuli, Patrick Chao, Sajel Shah, and Alicia Tsai. It was a research engagement, not a shipped product: an exploratory push to see how far unsupervised methods could get at surfacing anomalies from raw, unlabeled flight data, not a system Zipline put into production. Presenting our work at Zipline Demo Day II, after having walked their ranch and seen the drones in operation, was the clearest validation that the pipeline we built addressed a real operational need.
Zipline was my first exposure to applying machine learning to a live, safety-critical logistics system, and it set a pattern I would return to again and again: map the data before touching a model, and let two independent methods, here DTW and an LSTM autoencoder, corroborate each other before trusting a diagnosis. That instinct carried directly into the healthcare systems I would go on to work with.